

On September 12th, Ancestry released revised AncestryDNA ethnicity results. Many more reference samples were added to define the various ethnicities, and new strategies have been applied to analyze the DNA. This should result in more accurate results. Of course these are not perfect. (For more background see DNA Testing, What Do My Origin Percentages Mean?) Ancestry blogged about this, adding short video, here. Blogger Judy Russell wrote AncestryDNA ethnicity results updated. Blaine Bettinger wrote AncestryDNA Revises Ethnicity Estimates. Leah Larkin wrote Major Enhancement to AncestryDNA’s Ethnicity Estimates.
Overall, the results with small percentages have been filtered out and additional areas have been added or redefined. Taking Europe as an example, major changes include:
- Europe West – new regions France and Germanic Europe
- Europe East – new regions Baltic States and Eastern Europe & Russia
- Scandinavia – new regions Sweden and Norway
- Europe South – new regions Italy, Sardinia, and Greece & the Balkans
- Iberian Peninsula – new regions Basque, Spain, and Portugal
- Ireland/Scotland/Wales – redefined region Ireland and Scotland
- Great Britian – redefined region England, Wales & Northwestern Europe
- Finland/Northwest Russia – redefined region Finland
- European Jewish, no change
One interesting change here is for Great Britain. The new region called “England, Wales & Northwestern Europe” includes England and Wales as well as nearby areas in continental Europe. These continental European areas include the origin of the Germanic Anglo-Saxon wave of settlers into England. Also Brittany and Normandy in France. People with origins in England apparently generally share DNA with people with origins in these continental areas.
Leah Larkin’s blog post, noted above, lists the numbers of people who have been tested from each region, who define that population thus far. The most people tested for any region is Germanic Europe with 2072; the least is Basque with 22 people. Twenty-two isn’t a lot of people, but still many more people have been tested now than before.
My Results
For myself, my new and previous results compared:

Five ethnicities are no longer in my results: Iberian Peninsula, Finland/Northwest Russia, European Jewish, Europe South, and Africa North. My paper trail genealogy research does not lead to any of these groups, so no surprise there.
The rest of the results are pretty reasonable. The only group without a paper trail is 1% Sardinia. That seems odd. Maybe it will be filtered out on the next iteration.
Grandparent A’s Results
My ancestry is pretty mixed. It can help to look at two of my grandparents’ results who have less mixed ancestral origins. Here is one of my grandparent’s results:
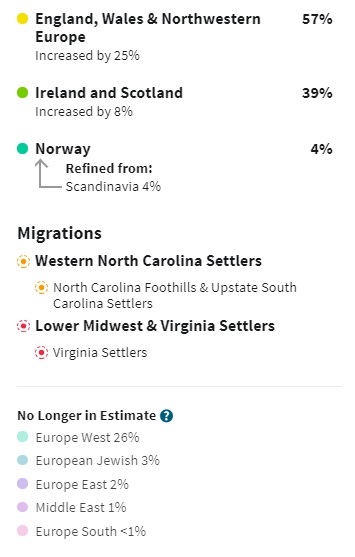
DNA will roughly align with ancestry, since more DNA is inherited from some grandparents than others. This person’s ancestry:
- 50% early Virginia settlers, British, mostly English
- 25% Swiss
- 12.5% English
- 12.5% Scottish (possibly intermarried with Irish)
Again, the smallest and most exotic groups are no longer in the estimate. This time the Europe West 26% is also gone, possibly somewhat replaced by the England, Wales & Northwestern Europe group which increased 25%. This person had a Swiss grandparent, so possibly that expanded England group also includes some German Swiss. But that’s not what the map currently shows. That is the biggest issue. The 4% Norwegian could be British either correctly or incorrectly being read as originally Norwegian. Also the Ireland and Scotland might be high.
Grandparent B’s Results
Last, a second grandparent’s results:
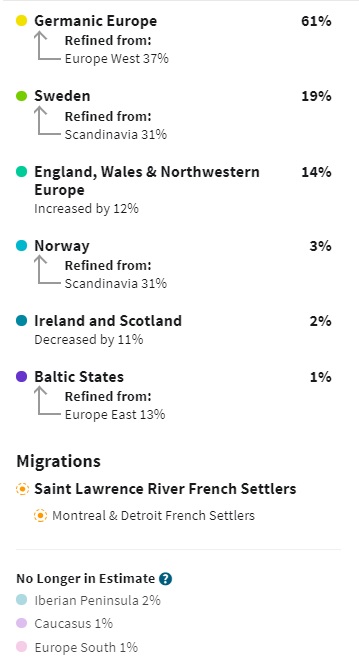
This person’s ancestry:
- 62.5% German
- 18.75% French-Canadian (French origin)
- 12.5% Danish
- 6.25% Scottish
Again, the small exotic percentages are no longer included in the update. The Germanic Europe numbers have increased even above the original Europe West numbers, and match well with what would be expected. Scandinavia as a whole has fallen, so is better, though the combined 19% Sweden and 3% Norway together still seem high. The Scottish could be low. And this result has no French ancestry. The new England, Wales & Northwestern Europe region does include northern France. Many of the French settlers of Canada did come from the northern coast. Perhaps this explains having no France in the results, but maybe not.
Conclusion
With this iteration of the AncestryDNA ethnicity results, several of the numbers appear to be moving in the right direction. New regions have been defined. Small percentages with no paper trail are falling off, an improvement. Unfortunately there still seem to be some issues with the results. Hopefully they continue to improve with the next iterations to come.
